Adult Income Prediction
1. Problem
The dataset come from 1994 Census database. Prediction task is to determine whether a person makes over 50K a year. Overall data is described in the following frame.
2. Solution
I use Pandas, XGBoost, Scikit-Learn, and Seaborn on Python to solve this problem.
2.1 Baseline model
I check the basic data validity first to build its baseline model.
data.info()Click here if you want to see the result
<class 'pandas.core.frame.DataFrame'>
RangeIndex: 34189 entries, 0 to 34188
Data columns (total 14 columns):
age 34189 non-null int64
workclass 34189 non-null object
fnlwgt 34189 non-null int64
education 34189 non-null object
education-num 34189 non-null int64
Marital-status 34189 non-null object
occupation 34189 non-null object
relationship 34189 non-null object
race 34189 non-null object
sex 34189 non-null object
capital-gain 34189 non-null int64
capital-loss 34189 non-null int64
hours-per-week 34189 non-null int64
native-country 34189 non-null object
dtypes: int64(6), object(8)
memory usage: 3.7+ MB
label.info()Click here if you want to see the result
<class 'pandas.core.frame.DataFrame'>
RangeIndex: 34189 entries, 0 to 34188
Data columns (total 1 columns):
>50K 34189 non-null int64
dtypes: int64(1)
memory usage: 267.2 KB
Both have no null values and because of that, the baseline model can be built without any data processing.
# One-hot encoding for categorial features
data_dummies = pd.get_dummies(data)

X = data_dummies.values
y = label.values

X_train, X_test, y_train, y_test = train_test_split(X, y.ravel(), random_state=0)

clf = xgboost.XGBClassifier(max_depth=8, n_estimators=300, learning_rate=0.5).fit(X_train, y_train)
print(clf.score(X_test, y_test))
Accuracy: 87.997192326%
2.2 Correlation Analysis
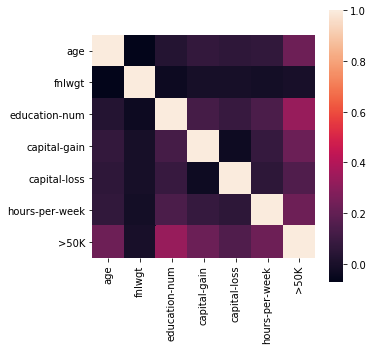
I concatenate people’s features data and their income label to analyse its correlation.
adult_income = pd.concat([data, label], axis=1)This following the correlation heatmap and the correlation matrix show no strong correlation without any pre-processing. I can see education-num is the most related with income in raw data.
I check the overall data distribution for numerical features and label. This shows there is no data fault in label as there are only 0 or 1, binary data.
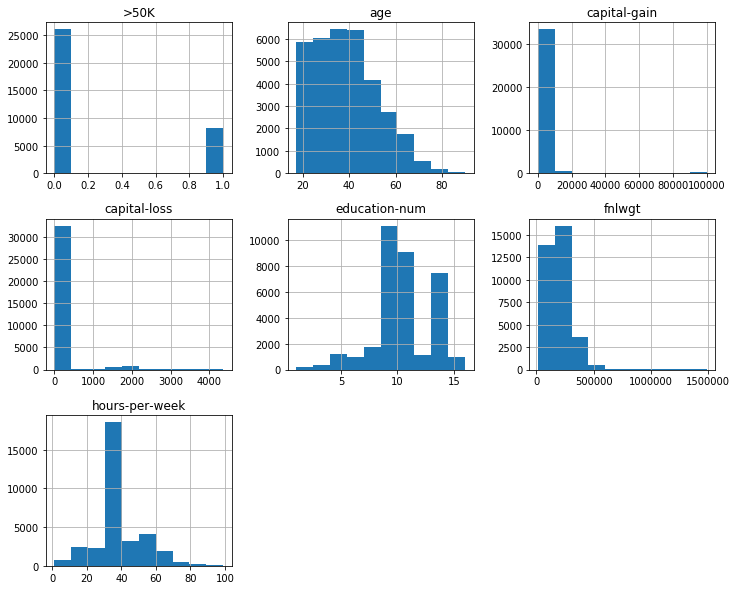
2.3 Data Reliability
Although the dataset is valid enough to run the baseline model, but I should check its reliability. With the above data distribution as histogram, I can’t say there is invalid values in numerical features, so I investigate categorial feature’s unique values to detection any problems. I can see some missing value represented as ' ?' in categorial features.
# for only categorial features
for c in adult_income.select_dtypes(include=['object']).columns:
    print(c + '\'s unique values:\n' , adult_income[c].unique(), '\n')
Click here if you want to see the result
workclass's unique values:
[' Private' ' State-gov' ' ?' ' Self-emp-not-inc' ' Local-gov'
' Self-emp-inc' ' Never-worked' ' Federal-gov' ' Without-pay']
education's unique values:
[' Assoc-voc' ' Some-college' ' 9th' ' 5th-6th' ' HS-grad' ' 12th'
' 7th-8th' ' 11th' ' 10th' ' Masters' ' Bachelors' ' Assoc-acdm'
' Prof-school' ' 1st-4th' ' Doctorate' ' Preschool']
Marital-status's unique values:
[' Never-married' ' Divorced' ' Separated' ' Married-civ-spouse'
' Married-spouse-absent' ' Widowed' ' Married-AF-spouse']
occupation's unique values:
[' Tech-support' ' Handlers-cleaners' ' Machine-op-inspct'
' Other-service' ' Craft-repair' ' Adm-clerical' ' ?' ' Exec-managerial'
' Protective-serv' ' Transport-moving' ' Prof-specialty' ' Sales'
' Farming-fishing' ' Priv-house-serv' ' Armed-Forces']
relationship's unique values:
[' Not-in-family' ' Own-child' ' Other-relative' ' Husband' ' Unmarried'
' Wife']
race's unique values:
[' White' ' Black' ' Amer-Indian-Eskimo' ' Asian-Pac-Islander' ' Other']
sex's unique values:
[' Male' ' Female']
native-country's unique values:
[' United-States' ' Mexico' ' El-Salvador' ' Germany' ' Philippines'
' Italy' ' ?' ' Jamaica' ' Canada' ' South' ' Columbia' ' China' ' Hong'
' Nicaragua' ' Puerto-Rico' ' India' ' Dominican-Republic' ' Haiti'
' England' ' Trinadad&Tobago' ' Taiwan' ' Cuba' ' France' ' Iran'
' Vietnam' ' Portugal' ' Cambodia' ' Japan' ' Guatemala' ' Thailand'
' Greece' ' Honduras' ' Poland' ' Hungary' ' Laos' ' Ireland' ' Ecuador'
' Yugoslavia' ' Peru' ' Outlying-US(Guam-USVI-etc)' ' Scotland'
' Holand-Netherlands']
I check ' ?', a missing data value, distribution for each categorial feature having it.
adult_income['workclass'].value_counts()Click here if you want to see the result
Private 23702
Self-emp-not-inc 2713
Local-gov 2218
? 1950
State-gov 1393
Self-emp-inc 1192
Federal-gov 995
Without-pay 16
Never-worked 10
Name: workclass, dtype: int64
adult_income['occupation'].value_counts()Click here if you want to see the result
Prof-specialty 4323
Exec-managerial 4285
Craft-repair 4244
Adm-clerical 3977
Sales 3852
Other-service 3407
Machine-op-inspct 2094
? 1960
Transport-moving 1672
Handlers-cleaners 1432
Farming-fishing 1084
Tech-support 982
Protective-serv 700
Priv-house-serv 168
Armed-Forces 9
Name: occupation, dtype: int64
adult_income['native-country'].value_counts()Click here if you want to see the result
United-States 30722
Mexico 669
? 589
Philippines 208
Germany 152
Canada 129
Puerto-Rico 127
India 107
Cuba 100
El-Salvador 100
England 89
South 82
China 79
Dominican-Republic 75
Italy 71
Jamaica 70
Guatemala 62
Columbia 61
Poland 60
Japan 56
Portugal 51
Vietnam 50
Taiwan 47
Haiti 47
Iran 41
Greece 35
Nicaragua 32
France 30
Peru 28
Ecuador 27
Hong 22
Trinadad&Tobago 22
Ireland 21
Cambodia 21
Thailand 19
Outlying-US(Guam-USVI-etc) 17
Yugoslavia 15
Laos 14
Hungary 14
Honduras 14
Scotland 13
Holand-Netherlands 1
Name: native-country, dtype: int64
2.4 Impute missing value
I use random forest, which is ensemble, to impute the missing value.
def decision_tree(objects, target, features):
  for feature in features:
    train = objects.copy()
    test = target.copy()

    y = train[feature]

    del train[feature]
    del test[feature]

    train_dummies = pd.get_dummies(train)
    test_dummies = pd.get_dummies(test)

    # in case for having different subset of features
    for c in train_dummies.columns.difference(test_dummies.columns):
        test_dummies[c] = 0

    for c in test_dummies.columns.difference(train_dummies.columns):
        train_dummies[c] = 0

    #clf = tree.DecisionTreeClassifier()
    #clf = ensemble.ExtraTreesClassifier(n_estimators=10)
    clf = ensemble.RandomForestClassifier(n_estimators=32)

    X_train, X_test, y_train, y_test = train_test_split(train_dummies.values, y.values, random_state=123)

    #tree.plot_tree(clf1.fit(X_train, y_train))

    clf.fit(X_train, y_train)
    print(clf.score(X_test, y_test))

    # predict
    for c in train.columns.difference(test_dummies.columns):
        test[c] = 0

    # impute missing values
    b = clf.predict(test_dummies.values)
    new_df = pd.DataFrame({feature: b})

    # combine
    imputed_df = target.drop([feature], axis=1)
    imputed_df[feature] = new_df.values

  return imputed_df
With random forest, the result of imputing missing value for native-country is about 92%, workclass is around 73%, but occupation is only 28% approximately.
[‘native-country’]
0.9215611974232664 Accuracy
[‘occupation’]
0.2865984590122521 Accuracy
[‘workclass’, ‘occupation’]
0.7327270430718706 Accuracy
0.2839459391183529 Accuracy
[‘workclass’, ‘occupation’, ‘native-country’]
0.7307060755336617 Accuracy
0.28419856006062905 Accuracy
0.9218138183655425 Accuracy
3. Future work
To be updated…